
This is the second part of a four-part series looking at the first quarter results of the 2016/17 financial year. Last week we looked at the Profit and Loss, this week we look at the Balance Sheet and undertake a quarterly review of your actual Q1 results compared to the budget and prior year.
Your Accountant or CFO or Virtual CFO should be providing you with your management reports and analysis within a week following month-end in a concise but comprehensive slide deck of six or seven slides/pages. The Balance Sheet will be one of the slides in the slide deck, which should be presented and discussed at your management review meeting.
BALANCE SHEET
The Balance Sheet is a report that shows ‘what you own’ and ’what you owe’ at a point in time, ie September 30th in this case. What you own are your Assets, and what you owe are your Liabilities and Shareholder’s Equity.

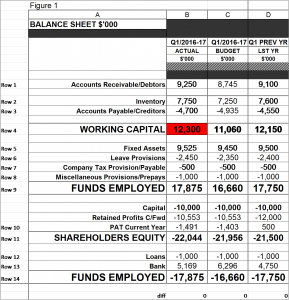
Back in Newsletter 19, you created your Budget Balance Sheet. Using that same format, below is an example of a Balance Sheet slide showing actual values as the end of Q1/2016-17 (Column B), Budget for end Q1 (Column C) and then the actual values as at the end of Q1 for the Prior Year (Column C); refer Figure 1 below. Graphs and charts can also be used for illustration purposes.
Each line of your Balance Sheet should be reviewed by your Accountant or CFO in the first instance comparing budget and prior year figures and flagging exceptions. TIP: I use a colour code system of RED (PROBLEM), ORANGE (WARNING) and GREEN (GREAT) as an effective flag for exceptions (refer Figure 1).
By understanding the assumptions on which the budget Balance Sheet numbers have been derived, you should be able to understand why your actual Balance Sheet figures vary to the budget. Key numbers such as Working Capital should have particular attention, refer Row 4 in Figure 1 below.
Ratios are also an excellent way to identify the health of your Balance Sheet. Some good examples include Stock Turns (if a product based business); Debtors Days Outstanding; Working Capital %; Quick Asset ratio, Return On Funds Employed (ROFE). Your Accountant or CFO should be across the best ratios to use for your particular business.
That is the beauty of Accounting and the ‘numbers’. When you understand what is behind them, you become more aware of issues in your business and can address them and measure the impact of your actions.
SUMMARY
Use this week to understand and analyse your Balance Sheet as at the end of Q1 to provide a sound foundation for business success.
NEXT WEEK
Next week will move to the third Q1 report, a Cash Flow statement.
Ross – Billson Advisory


