Monthly Archives: May 2016

Business Blog No. 13 – Cost of Sales Budget Part 2 – Direct Labour

This week is the second part of a 3-part topic focussed on developing a Cost of Sales Budget for the next financial year. Last week we looked at Cost of Sales – Materials, now the objective is to determine the Cost of Sales – Direct Labour for your budgeted sales.

The definition of direct labour in a cost of sales context for both products (Cost of Goods Sold) and services (Cost of Services) is the labour that ‘touches’ or ‘adds value’ to the product or service produced and which varies directly with the volume of production of the product or service . It is effectively the variable labour required to produce a product or service, but excludes supervision and support departments. Note that this week’s topic is not relevant to import/distribution/reseller entities that don’t produce goods or services.

The labour cost components to be included in your direct labour costs include not only the wage/salary of the direct employee but also overtime, shift allowances and bonuses etc, plus oncosts such as workcover, payroll tax, superannuation and leave provisions. You also need to ensure that you reflect EBA (Enterprise Bargaining Agreement) or budget wage rate increases in your budget dollars.

Calculating how many direct labour personnel headcount, and hence dollars, are to be included in your direct labour budget is the next task.

MANUFACTURER/SERVICE PROVIDER – IF YOU HAVE LABOUR ROUTINGS BY PRODUCT/SERVICE

If you have a computer system, or excel spreadsheets that you use for labour routings by product/service showing how many hours it takes to setup and produce the product/service across the various production work centres, you can extrapolate these hours by the volumes of sales budget to come up with budgeted productive direct labour hours. This can then be converted back to labour heads and hence direct labour hours. Don’t forget to factor in non-productive down-time and vacations.

You then need to consider efficiency improvements you may have included as part of your strategic planning process and reflect those in your direct labour budget also.

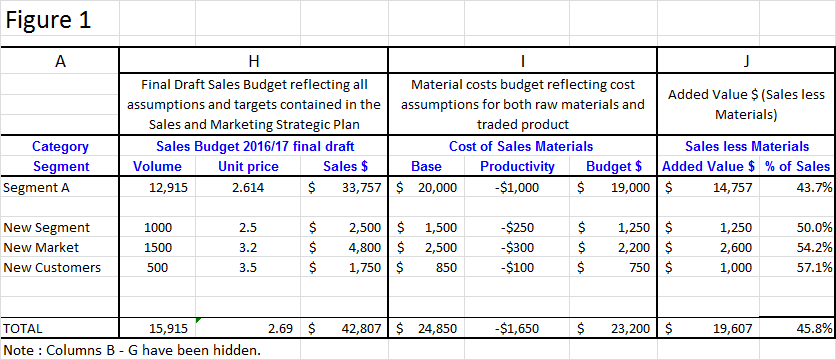
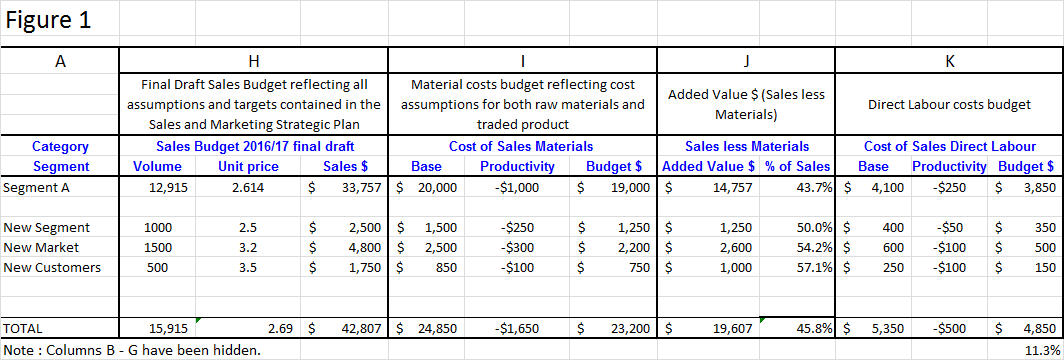
Once the heads are determined, you need to determine the budget cost of the direct labour personnel. Multiply your budgeted direct labour headcount by the annual cost of each direct labour head (including oncosts noted above). Note that you can then derive ‘budget labour recovery rates’ for your work centres and ‘push’ back into your labour routes so as to build up budget direct labour costs by product/service, refer Figure 1, column K.

spreadsheet blog 13


MANUFACTURER/SERVICE PROVIDER – IF YOU DON’T HAVE LABOUR ROUTINGS

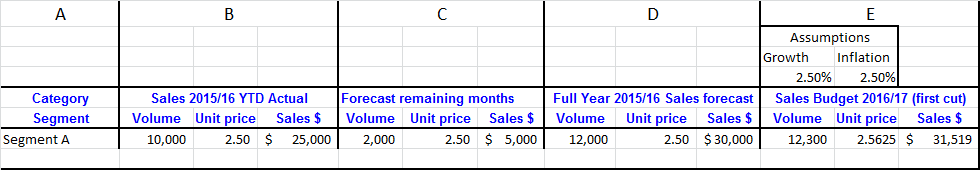
If don’t have a labour routing system, you are best to look at using the actual current year-to-date (YTD) volumes and actual direct labour YTD as a starting point and pro-rata direct labour costs for the volume movements between current year forecasts and budgeted volumes for next year. Factor in wage/inflation increases but also reflect any productivity initiatives you have identified in your strategic planning process to give you a direct labour budget.

START-UP MANUFACTURER/SERVICE PROVIDER

If you are a start-up, hopefully your research will have identified the direct labour resources you will need to deliver your product/services based on your budgeted volumes. Put some values around the headcount requirement for direct labour to produce your product/service for the financial year by applying annual labour cost including overtime (including premium), shift allowances, bonuses, superannuation, payroll tax and workcover.

Use this week to develop the second component of your Cost of Sales budget, your Direct Labour Budget for the next financial year, to provide a sound foundation for business success.

As always, if you need some help or guidance, don’t hesitate to call me on (03) 9554-3128.

Next week we move to the third part of the Cost of Sales budget, Direct Variable Expenses, after which you will be able calculate another key metric: Gross Margin.

Ross

Business Blog No. 12 – Cost of Sales Budget Part 1 – Materials

This week is the first part of a 3-part topic focussed on developing a Cost of Sales Budget for the next financial year.

Last week concluded with the creation of your business’ ‘final draft’ Sales Budget. Now the objective is to determine the Cost of Sales budget for these sales, starting with Materials. If you are a services business, the information that follows won’t be relevant to you. Tune into next week’s blog for more appropriate information for you if you don’t deal in products.

The Material component of Cost of Sales includes both ‘Bills of Materials’ or ‘Recipe’ for your manufactured product, as well as the Cost of Sales for Product Purchased for Resale by a distribution entity.

The first step is to determine your budgeted raw material unit costs and budgeted purchase product unit costs from your suppliers for the next financial year. Try to lock in pricing from your suppliers for the next year or at least give indicative pricing, as well as an inflation allowance for this purpose.

If you are importing raw materials and/or finished goods, you will need to make some assumptions about exchange rates. Speak to your business banker and ask if they can provide you with the banks forecast exchange rates. Use these to calculate your import purchase unit costs, including duty and shipping if applicable, back into Australian dollars.

MANUFACTURER – IF YOU HAVE BILLS OF MATERIALS OR RECIPE

If you have Bills of Materials or Recipes for your manufactured product, you will have material requirements to make a unit of each product. Multiplying the material requirements for a unit of product by the budget raw material costs will give you budget material cost per unit by each finished item. Don’t forget to include scrap allowance or waste allowance.

Multiplying your budgeted sales volumes and your budget material cost per unit will give you your first look materials budget. Hopefully you can break down the material budget by your sales categories.

Using the Sales budget spreadsheet example that we have used in previous blogs, add in three more columns (see Figure 1, Column I below). The first column is your base materials budget as has just been determined.

Refer to your Strategic Plan; did you come up with some productivity improvement targets or actions around your material costs? Maybe you are changing suppliers, or reducing scrap rates due to Six Sigma/lean initiatives? Maybe you are changing you recipes/bills of materials to substitute a different material mix? There should be some continuous improvement targets for materials and these should be reflected in your budget. Refer to the second column within Column I for examples.

MANUFACTURER – IF YOU DON’T HAVE BILLS OF MATERIALS OR RECIPES OR YOU ARE A START-UP

If you don’t have the ‘Bills of Materials’ (BoM’s) or Recipes at a manufactured product level, you can always use a listing of your material purchases year to date and adjust those values for changes in your volumes and factor in price changes at a macro level.  You would still want to reflect productivity initiatives that have come out of your strategic planning process and hopefully you can at least arbitrarily attach the budget costs to Sales categories; see figure 1 column I below for an example.

If you are a start-up manufacturer, hopefully you will have researched your material requirements and recipes and determined the type and quantity of materials you will need. From your research, you should have some indicative prices from suppliers and therefore be able to estimate a rough materials budget.

DISTRIBUTOR/RESELLER

If you are an import/distributor or reseller you will need to come up with budget product purchases reflecting your sales budget. The process for setting unit costs for the coming year is simpler than for a manufacturer but the logic is still the same. By multiplying your budgeted sales volumes by your Purchase product budgeted unit costs, plus any duty or freight etc that may be applicable. you will have your first look materials budget. Try to break down the material budget by your sales categories.

The third column of Column I in Figure 1 below is the sum of base material costs less productivity material improvements.

Sales less material gives you the metric known as Added Value. Add a further column to your spreadsheet to reflect Added Value $ and % (Refer Figure 1, Column J).

spreadsheet blog 12

Use this week to develop the first component of your Cost of Sales budget; your Materials Budget for the next financial year to provide a sound foundation for business success.

As always, if you need some help or guidance, don’t hesitate to call me on (03) 9554-3128.

Next week we move to our second part of Cost of Sales budget, direct labour.

Ross

Business Blog No. 11- Strat Planning – Sales Budget Part 2

This week is the second part of a 2-part topic focussed on developing a Sales Budget for the next financial year.

Last week we put together a full year sales forecast for the current financial year and then a first cut sales budget using the forecast as a starting point and factoring in base growth and price assumptions.

Now the objective is to extend that first cut sales budget into something you might call a final draft Sales Budget. As always, if you need some help or guidance on the material herein, don’t hesitate to call me on (03) 9554-3128.

You might recall we developed a Sales and Marketing Strategy a few weeks back. Now it is time to feed the financial targets developed from the initiatives contained in your Sales and Marketing strategy into your Sales Budget.

At the very least, you should be targeting growth greater than the market (so you gain market share) and budget for price increases higher than inflation. Remember you are more a ‘price-setter’ than a ‘price-taker’ because you are now differentiating your business and marketing yourselves as providing value beyond price.

Extending the spreadsheet we created last week (see Figure 1 below), let’s add three more columns represented by Column F. In these columns enter the increase in volume and price beyond the industry base due to the influence of your Sales and Marketing Strategy. Multiply the new volumes by the new price to create a ‘second-look’ Sales Budget.

Beyond the broad market share and price effect assumptions of your Strategic Plan, you should also have identified additional new innovative products/services or new markets or targeted new customers. These need to be added into your sales budget, volumes and prices, above and beyond our ‘second look’ Sales Budget. Let’s add some new rows to the spreadsheet under column A for each of these initiatives and attach budget volumes, budget prices and budget sales dollars for each. Include these items in column G of the spreadsheet (refer Figure 1 below).

As an aside, are you budgeting any export sales? If so, you will need to make some assumptions about exchange rates. Speak to your business banker and ask if they can provide you with the banks forecast exchange rates. Use these to calculate your export sales budget back into Australian dollars.

Assuming you have captured and added in all the initiatives from your Sales and Marketing strategy, adding column F to column G of the spreadsheet gives you your ‘final draft’ Sales Budget, represented by column H. It is not a ‘final’ Sales Budget until the full budget is complete but you now have your starting point. A Sales Budget is the key part of a business’ overall budget and is the first stage in the budgeting process.

spreadsheet blog 11

Use this week to further develop your Sales Budget from ‘first-look’ to ‘final draft’ for the next financial year using your Sales and Marketing Strategy as a pillar of the budget and to provide a sound foundation for business success.

Come and visit us at our stall at the Smart Manufacturing 16 Expo on Tuesday May 17.

http://www.smartmanufacturing.com.au/

Smart Manufacturing logo may 2016

Business Blog No. 10 – Strat Planning – Sales Budget Part 1

This week is the first of a 2-part topic focussed on developing a Sales Budget for the next financial year.

This topic can be a bit dry and challenging, but I ask you to stay with me and take the time digest the materials in this week’s newsletter. If you need some help with any of the materials don’t hesitate to call me on (03) 9554-3128.

Existing Businesses – Current Year Sales Forecast

The first step in developing next year’s Sales Budget is to put together a Sales Forecast for the current financial year. A simple spreadsheet is a handy tool for this purpose (see Figure 1 below).

If yours is an existing business, do you know your current year-to-date (YTD) sales volumes by product or service or customer category and the actual total sales dollars YTD for each? Your accounting system should have this information. Put this YTD information in columns in a spreadsheet (refer Figure 1 columns A and B as an example), and compute average selling price by dividing sales dollars by volume.

Next add another 3 columns to your spreadsheet and put in the forecast sales volume, unit price and forecast sales dollars for the remainder of the current financial year (refer Figure 1 column C).

Adding your actual YTD units and YTD dollars plus your remaining period forecast units and dollars gives you a full year sales forecast by category. Compute your average unit price for the full year (refer Figure 1 column D).

Existing Businesses – Next Year Sales Budget

Now you have your current full year Sales Forecast, add some additional column on your spreadsheet for your 2016/17 Sales Budget (volume, price, budget sales $ columns, refer Figure 1 column E). Next make some assumptions about economic growth in your industry (say 2.5% as an example). To keep your existing market share, you will need to grow volumes by at least that amount. Increase your forecast volumes by the assumed growth % to come to a first-cut Sales Budget Volumes by product/service or customer.

The next part of the equation is Price. Make an assumption about inflation in your industry for the next 12months (say 2.5%). If you don’t recover inflation increases, your sales dollars won’t keep up in real terms. Multiply the forecast average prices by inflation to come up with new Budget Sales prices by product/service/customer.

Multiplying your Sales Budget volumes by your Sales Budget unit prices, you get your first-cut 2016/17 Budget Sales dollars by product/service or customer.

blog 10 spreadsheet

New Businesses

If your business is just starting out, your approach by necessity will be different. Have you got any sales data so far, or do you have a feel for any sales you may make before the end of this financial year? Using your market research and Sales and Marketing Strategy, start by estimating how many customers by week by month you think you will get and how many sales orders you expect to fill by quantity for each of these target customers. Organise this information by product or service for each customer. Using your selling price assumptions, you can come up with projected sales dollars by product/service offering or customer, in other words a Sales Budget. It can be quite difficult to estimate these figures with confidence, but the best thing to do is make a start. As the saying goes, “the greatest journeys start with that first step”.

Use this week to develop your ‘first-look’ Sales Budget for the next financial year using a full year Sales Forecast for the current financial year as a starting point. Next week we will expand on this draft Sales Budget to get to a final draft Sales Budget to provide a sound foundation for business success.

Come and visit us at our stall at the Smart Manufacturing 16 Expo on Tuesday May 17.

http://www.smartmanufacturing.com.au/

Smart Manufacturing logo may 2016

Business Blog No. 9 – Sales and Marketing Strategy