Monthly Archives: July 2016

Business Blog No 22 – SuperStream

SuperStream is a government initiative which details the way businesses are to pay employee superannuation contributions to superannuation funds. Businesses with 20 or more employees are already required to use the system, with small businesses with 19 or fewer employees needing to put the system in place. The original deadline for small businesses to be ‘Superstreamed’ was June 30, 2016, but the ATO are showing flexibility by extending this deadline to October 28, 2016. From my perspective, I highly recommend you cross over to the new regime as soon as possible as there are productivity and efficiency improvements to be gained.

SuperStream transmits money and information in a consistent format across the super system between employers, funds, service providers and the ATO in a single transaction, even if you deal with multiple super funds. The data is linked to the payment by a unique payment reference number.

How your business becomes SuperStream compliant is your choice. Options include using a compliant payroll system, using a super fund’s online system, using a messaging portal or using a super clearing house like the ATO’s Small Business Super Clearing House (SBSCH). For your information, the ATO’s SBSCH is a free, optional service for small business with 19 or fewer employees.

You don’t need to use SuperStream for contributions to your own self-managed super fund (SMSF) if you are an employee of your family business, or if you are a sole trader and you make personal superannuation contributions to a super fund for yourself. For these types of contributions you just keep using your previous processes.

If you need help getting SuperStream compliant, don’t hesitate to contact us on (03) 9554-3128.

Ross – Virtual/Part-Time CFO

Business Blog No 21 – Budget – It’s a Wrap!

Last week, you completed the last piece of your budget financials for the new financial year, your Cashflow Budget.

Congratulations on completing your 3 months budget creation journey! I hope you have learnt a few things along the way.

You should now have a phased Profit and Loss budget, a budget Balance Sheet and a budget Cashflow Statement.

RESPONSIBILTY AND ACCOUNTABILITY

Now that you have created these budgets for your business, you need to assign responsibility and accountability for components of the budgets to personnel in your organisation. I would suggest the following as an indicative responsibility assignment:-

Profit and Loss Budget

  • Sales Budget responsibility – Sales Manager
  • Distribution Overheads responsibility – Distribution Manager
  • Selling Overheads responsibility – Sales Manager
  • Administration Overheads responsibility – Accountant, Finance Manager or Virtual Part-Time CFO
  • If you are a manufacturer, your manufacturing budget – including direct materials, direct labour, direct overheads and Production Overheads responsibility – Production Manager
  • If you are a distribution company, your cost of sales budget responsibility – Purchasing Manager
  • If you are a service entity, your direct cost of services responsibility – Operations Manager.

Balance Sheet Budget

  • Accounts Receivable Budget responsibility – Accountant, Finance Manager or Virtual Part-Time CFO
  • Inventory – Raw Materials responsibility – Purchasing Manager; Work in Progress and Finished Goods responsibility – Production Manager.
  • Accounts Payable Budget responsibility – Accountant, Finance Manager or Virtual Part Time CFO

MEASUREMENT

Once you have assigned responsibility for budget areas, you need to ensure the relevant personnel are accountable for their budget areas, by measuring and reporting actual numbers against the budgets every month. This will require the development of a reporting structure and comparison reports. These reports and numbers should form part of your monthly review meeting focussing on exceptions that need action, explanation or further investigation. Such reports and analysis can be prepared by the Accountant, Finance Manager or Virtual Part Time CFO to ensure independence and impartiality.

SUMMARY

Use this week to assign responsibility for budget targets and develop a reporting and accountability structure so each month you can measure and compare the progress of your actual numbers against your budget numbers. Once you start measuring things, it is amazing how quickly improvement can actually come from the simple measuring process itself, as well as the identification of improvements opportunities.

All the best for a prosperous and successful financial year! As always, if you need some help or guidance, don’t hesitate to call me on (03) 9554-3128.

Next week we will move away from the budget process and onto some new topics to provide a sound foundation for business success.

Ross – Virtual Part-Time CFO

Business Blog No 20 – Budget CashFlow Statement

Last week, you completed a budget Balance Sheet for the next financial year.

This week, we will look at another key budget document: your budget Cashflow Statement. This is an important component of your budget because it will identify your budgeted cash movements and cash position. Knowing where you are going to be in terms of your money is critical so plans can be made to supplement cash if required, manage cash requirements and invest if surplus cash availability is your outcome.

The beauty of creating a budget Cashflow Statement in excel is that when it is properly connected to your budget Profit & Loss (P&L) and budget Balance Sheet, the numbers for the budget cashflow statement should just automatically flow through.

Refer Figure 1 below as an example of a simple fictitious budget Cashflow Statement which is linked to the budget templates presented in previous newsletters. Column A represents broad categories of your Cashflow Statement and Column B is your budget cash movements for each of those categories.

Working through each of the key cash flow items in turn as follows:-

  • Profit and Loss After Tax – refer Row 1 below – this amount is directly transferred from your budget P&L. Note this figure includes non-cash items such as depreciation. Depreciation of Fixed Assets (refer Row 2 below) needs to be added back from your budget P&L depreciation expense so as to determine Cash Inflow(Outflow) from Operation (refer Row 3 below).
  • Inventory Movements – refer Row 4 below – this is the difference between your actual closing inventory balance from prior year and the budget inventory closing balance in your balance sheet. A positive number means you are reducing inventories which effectively impacts cash favourably.
  • Receivables/Prepayments Movements – refer Row 5 below – as with the inventory above, this figure represents the difference between prior year actual closing balance and budget current year budget closing balance in your balance sheet. A positive number means you are reducing Receivables which effectively impacts cash favourably.
  • Accounts Payable Movements – refer Row 6 below – this figure represents the difference between prior year actual closing balance and budget current year budget closing balance in your balance sheet. A positive number means you are increasing Payables which effectively impacts cash favourably.
  • Non-Current Movements – refer Rows 8 and 9 below – as above, the figures represent the difference between prior year actual closing balance and budget current year budget closing balance in those balance sheet categories. A positive number means you are impacting cash favourably.
  • Fixed Assets movements – refer Rows 11 to 14 below – the figures in this section represent budgeted cash movements in your Fixed Assets such as Capital Expenditure and/or Proceeds from Sale of Assets. A check on this number is done by subtracting budget depreciation expense from closing actual Fixed Assets written-down-value and comparing it to budget closing fixed assets.
  • Shareholders Equity movements – refer Rows 15 and 16 below – this is usually zero but if owners are contributing more capital to the business, it needs to be factored into this section.
  • Manual Adjustments – refer Row 17 below – I don’t like using this section as it is a ‘plug’ to make the Cashflow Statement balance. Only use it if there are small roundings.
  • Net Cash Generated – refer Row 18 below – summing all of the above you get to a figure showing your net movement in cash. Make sure it makes sense. If it is a negative figure, do you need to revisit either your Balance Sheet or Profit and Loss statements? Do we need to curtail Capital Spending or more aggressively target customer collections?
  • Cash Funding – refer Rows 19 to 22 – picking up opening and closing budget Bank/loan balances from your Balance Sheet, you will identify how you are budgeting to fund cash shortfalls or allocate cash surpluses. The total in Row 22 should equal the value shown in Row 18.

Do you need to organise funding in advance for your business to remain solvent or have you got surplus funds that can be invested to generate a return above bank interest?

If there is a seasonality factor to your business, you should look at doing a monthly phased budget Cashflow Statement so you can identify the peaks and troughs of your cashflow needs and plan ahead for any such requirements.

spreadsheet blog 20

SUMMARY

Use this week to develop your budget Cashflow Statement and hence identify budget cashflow movements in and out of your business, sources of cashflow in your business and identify future Bank/Funding requirements as part of your budget process.

As always, if you need some help or guidance, don’t hesitate to call me on (03) 9554-3128.

Ross – Virtual CFO

Business Blog No 19 Budget – Balance Sheet

Last week, you finalised phasing your Profit and Loss (P&L) budget for the next financial year.

This week, we will look at another key budget document: your budget balance sheet. This is an important component of your budget because it will drive one of your key strategic objectives as noted in Blog 7: Cash!

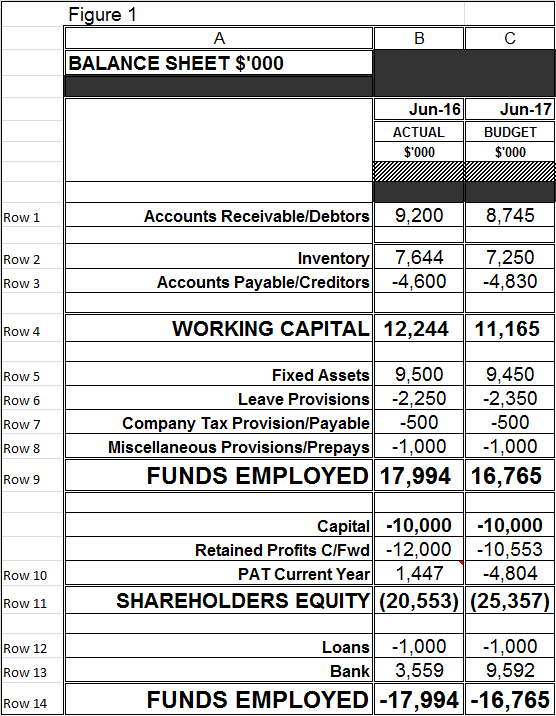
Refer Figure 1 below as an example of a simple fictitious Balance Sheet where Column A represents broad categories of your Balance Sheet, Column B is your current actual balance sheet values and Column C is your budget balance sheet for the forth coming financial year.

Working through each of the key balance sheet items in turn with your current actual balance sheet and ratios as a starting point:-

  • Accounts Receivable/Debtors – refer Row 1 below – you should budget an improvement in your debtors days outstanding of at least 50% and hopefully it sits below 60days.
  • Inventory – refer Row 2 below – as with the Accounts Receivable, you should budget an improvement in your inventory days held of at least 5% and hopefully it is below 90days.
  • Accounts Payable/Creditors – refer Row 3 below – the goal is to increase the number of days; which is opposite pattern to Debtors/Inventory. It should mirror the Debtors days as a target but for budgeting purposes let’s assume you increase payable days by 5% for your budget.

As an illustration, if your Working Capital (Debtors plus Inventory less Creditors) is $100k and you improve each of Debtors, Inventory and Creditors by 5%, that equates to an extra $5k in cash to your business.

  • Fixed Assets – refer Row 5 below starting with from your closing down written value of Fixed Assets, add your additions and subtract your disposals and subtract your depreciation expense to calculate a budget Fixed Assets values.
  • Leave provisions (Annual Leave and Long Service Leave) – refer Row 6 below. Using your closing actual leave provision values and assuming that the budget is for all employees to take their 4 weeks Annual Leave, the Budget Annual Leave provision will only increase by pay rate increases. Long Service Leave is a little more difficult as the entitlement and taking of long service leave needs more detailed analysis, sometimes at an individual level.
  • Company Tax Payable/GST – refer Row 7 below. These amounts payable to the government should be estimated for budget purposes.
  • Miscellaneous Provisions/Prepayments – budgeting for these general accruals and prepayments should be fairly straight forward, use closing values as a guide to calculate these.

Summing up all of the above gives you your Funds Employed values for both actual and your budget. Refer Row 9 below. Funds employed gives you the value your net assets excluding bank/loans, of the business. The way these net assets have been funded through shareholders equity, loans and bank balances is totalled up at Row 14 below. Note that as a Balance Sheet principle, it needs to balance whereby row 9 is to equal row 14.

The Shareholders Equity section of your Balance Sheet is where your accumulated profits and capital amounts reside. Your P&L Budget Profit After Tax will transfer into this section Refer Row 10.

The ‘magic’ number/s that drops out to balance your budget balance sheet are your loan/bank balance (Rows 12 and 13 below). This will give you the picture of where the financing of your business is projected to be based on your P&L Budget and the components of your budgeted Balance Sheet.

The question/s might be, do you need to organise additional funding? Will you have excess funds available for investment? Do you need to review your capital expenditure?

spreadsheet blog 19

SUMMARY

Use this week to develop your budget Balance Sheet and hence identify Bank/Funding requirements as part of your budget process.

As always, if you need some help or guidance, don’t hesitate to call me on (03) 9554-3128.

Ross – Virtual CFO

Business Blog No 18 – Budget Profit and Loss Monthly Phasing

Last week, you finalised your Profit and Loss (P&L) forecast for the current year and budget for the next financial year.

This week, we will look at the phasing of the budget P&L by month so you can use your phased budget to compare actuals results each month.

Using your excel spreadsheet model from last week (Figure 1 below), add in another 13 columns representing each month of the new financial year and a total, refer Column G below.

There are a variety of ways of phasing your budgets. Obviously you want to select the method that best allocates budget revenue and costs in the most realistic expected pattern for each category of items in your P&L by month. Some entities plot historical values and mirror the percentage proportion across months in their new budget phasings. Some entities simply divide the full year budget by 12 and use those figures for each month. Some entities allocate across months based on working days by month. Others use seasonal adjustment factors to phase across months. Others use a hybrid version of all of the above.

I recommend that you keep it simple. You want your  budget phasing to be reasonably accurate, but it doesn’t have to be precise. Even if you over simplify the phasing, any monthly variations will just be timing variances as every month adds up to the full year totals no matter what method you adopt.

WORKING DAYS PHASING

I recommend using the working days allocation method. This method provides not only the simplicity you seek, but a level of accuracy that is reasonable if your average daily sales values are consistent across the year (and hence are not seasonal) and you incur costs in such a pattern too. Naturally if you are aware that you will generate revenue is a seasonal manner or you will incur certain costs in a differing pattern across the year, make the relevant adjustments to your phasings. An example of costs for which a working day allocation is not reasonable is if you are a manufacturer and you shut down annually to do annual preventative and planned maintenance generally over the Christmas and January period. In this instance, your Repairs and Maintenance (R&M) budget phasing will need to be adapted to reflect the fact that major R&M costs will be incurred when the business is actually closed.

I have simulated the phasing using the working day method as illustrated in the following model (Figure 1, Column G and Row 1). Note that I have assumed that the business is closed 4 weeks per year (spread across December/January and April Easter) for annual leave/shutdown and for 2 weeks of Public Holidays. This leaves the business open 46weeks of the year which equates to 230 working days.

spreadsheet blog 18

SUMMARY

Use this week to phase your final Profit and Loss Budget by month ready for the new financial year so you can start comparing and measuring actual results each month against your budget each month.

As always, if you need some help or guidance, don’t hesitate to call me on (03) 9554-3128.

Are there any topics you would like me to cover in upcoming blogs? Are there any issues or ‘pain-points’ you would like to see covered?

Ross – Virtual CFO