Monthly Archives: June 2016

Business Blog No 17 – Budget Profit and Loss Statement

Firstly, congratulations for coming on this journey with me so far! This week, we pull everything we have done for your forecast and budget together to come up with a Profit and Loss (P&L) Forecast for the current financial year and P&L Budget for next financial year. Very exciting!

Using the information developed so far, and your excel spreadsheets, following is a schedule (Figure 1) that pulls it all together to give us a first look at your first cut P&L Forecast and Budget. Note, I have used most of the numbers used so far as illustrations, they are fictitious numbers and some have been altered for illustration purposes only.

Figure 1

spreadsheet blog 17 no 1

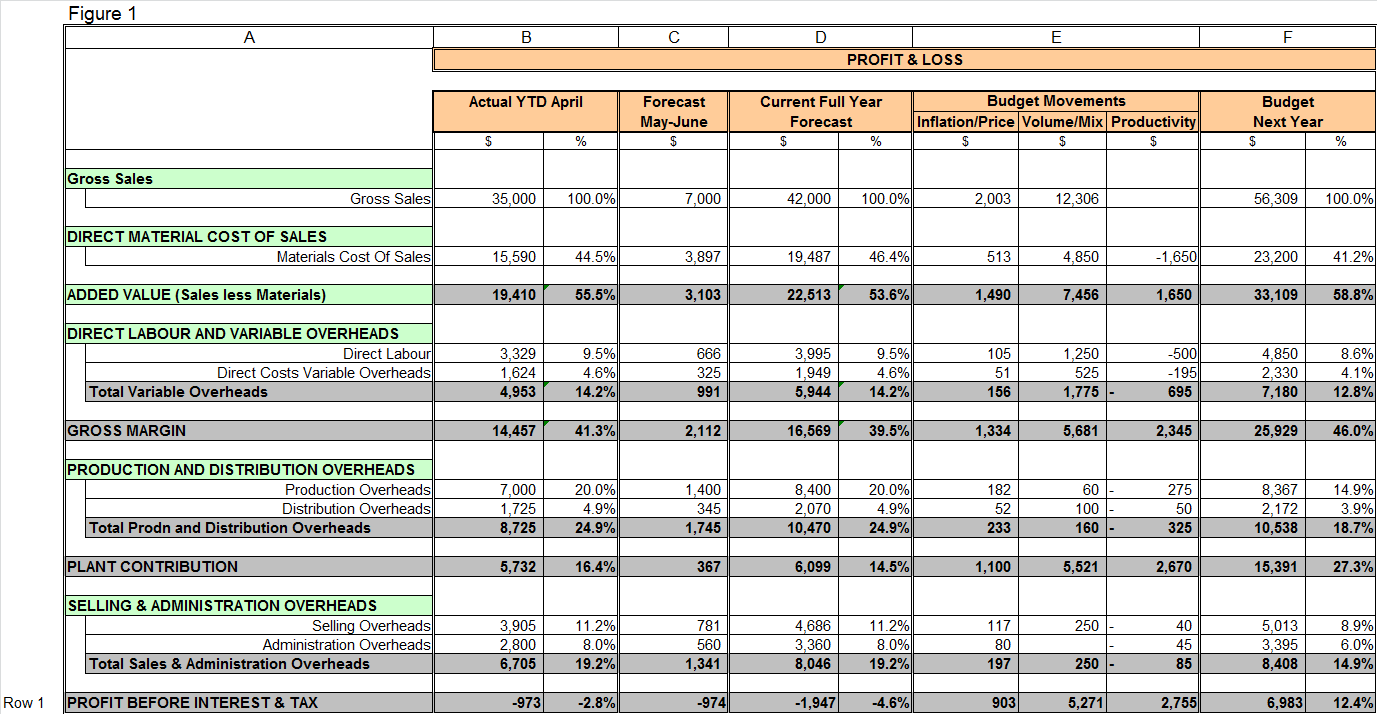
  • Column A lists out the P&L categories used in your workings so far.
  • Column B is the actual year-to-date April figures for each P&L category, plus some percentages for reference.
  • Column C is the forecast derived for the May and June months for each P&L category.
  • Column D is the current full year forecast for each P&L Category, plus some percentages (Column B plus C).
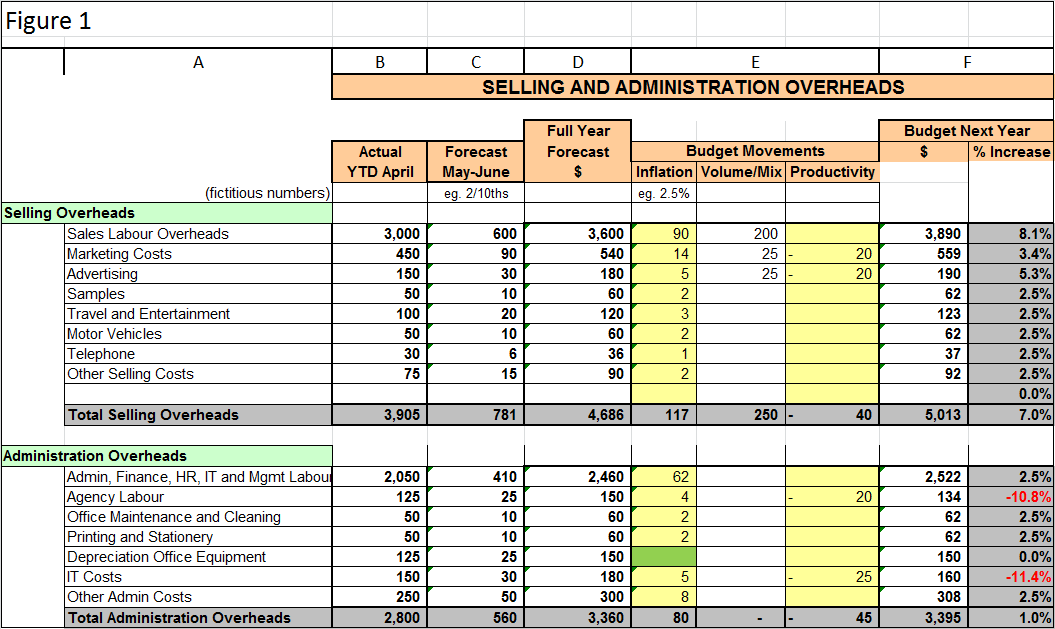
  • Column E is the budget movements in “Inflation/Price”, “Volume/Mix” and “Productivity” improvements for each P&L category you have determined.
  • Column F is the next financial year budget as computed by each P&L Category, and reflects the sum of column D plus the three sections of column E. Percentages are also illustrated for reference and comparison purposes.

Looking at all the information you have complied, you will have determined a Profit before Interest and Tax (PBIT) figure in Row 1. How does it look? Does it make sense? Is the year-to-date figure correct and does it match your actual numbers? Is the current year forecast reasonable given you are coming towards the end of the financial year? Do the ‘price’ and ‘volume’ figures look reasonable and does the ‘productivity’ total saving figure in Column E Row 1 agree with your Strategic Plan initiatives?

If you are happy with what you are seeing, you need to add a few more rows to the spreadsheet as noted below, Figure 1, Rows 1 to 5. Row 1 is the Profit Before Interest and Tax (PBIT) as per above.

spreadsheet blog 17 no 2

If you have borrowings, loans or a bank overdraft for your business, you will be paying interest to the applicable financial institution/s. Row 2 is where you show the interest expense you are forecasting and budgeting to pay. Subtracting the interest expense amount from your PBIT will give you Profit Before Tax (PBT), refer Row 3. Applying a standard tax rate of say 30%, you will determine your Tax Expense in Row 4.

Subtracting tax expense from PBT gives you Profit After Tax (PAT), Row 5. This is possibly the most important number you have! Is it positive? Does it look reasonable? Does the number give you the desired Return on Investment you identified in week 7? You should recall that you need to be making a return on your investment (ROI) to reflect the risk you are taking. If you are not achieving your target return on business investment, you need to have a plan to get you there, if not in this budget year, at least in the medium term.

If you are not making that required return on investment, what areas can you focus on to get to that required level of return? Can you aggressively budget more sales growth harder? Increase prices further? Do some cost cutting? Make further productivity improvements? Or a combination of all of the above? Is it something that needs to be done over a number of years?

SUMMARY

Use this week to pull together your first draft forecast and budget Profit and Loss (P&L) and look at where you are at insofar as Return on Investment (ROI) objectives. Review and adjust your forecast and budget accordingly to come to a final P&L forecast and budget and provide a sound foundation for business success.

As always, if you need some help or guidance, don’t hesitate to call me on (03) 9554-3128.

Next week we will look at phasing your final budget by month ready for the new financial year so you can start comparing actual results for each month against your budget.

Ross

Business Blog 16 – Budget – Selling and Administration Overheads

Last week you completed your first category of budget overhead expenses: Production and Distribution Overheads.

This week, we move onto the second and final category of budget overhead expenses: Selling and Administration Overheads. Every business needs to sell to survive and every business will have administration costs to incur. So this overhead category will apply to all entities whether they are manufacturers, distributors, service entities or start-ups.

SELLING AND ADMINISTRATION OVERHEADS – EXISTING BUSINESSES

Selling Overheads include costs such as Sales and Customer Service personnel costs, Marketing costs, Mobile phones, Motor Vehicles, Travel and Entertainment, Advertising costs, Samples, Promotions and Website costs. Administration Overheads will include Accounting, Administration, IT and HR personnel costs, General management costs, IT Costs, Legal Fees, Stationery, Office Equipment depreciation etc. The process and concepts that follow are equally applicable to both types of overhead costs and to all entities that incur any of these types of costs. It basically mirrors the process you followed to develop your Production and Distribution Overheads previously.

Your accounting system should already be reporting the actual costs as separate line items so this is your starting point for your current year forecast and then budget. A simple spreadsheet will again be useful for preparing the forecast for the current financial year and budget for next financial year. Collect the year-to-date (YTD) actual costs by category. Let’s assume you have YTD actual costs for the 10months to April, refer Figure 1, Columns A and B below. Next you need to forecast the next 2months costs. A simple pro-rata using YTD Actuals can work if you have no other information to go on, refer Column C below. Adding these two numbers together gives you your current year full year forecast, refer Column D.

Next, add another 3 columns to your spreadsheet and put in ‘inflation’, ‘volume/mix’ and ‘productivity’ columns representing movements from your forecast to your budget figures (refer Figure 1 column E). ‘Inflation’ would reflect known EBA or payroll rate increases from year-to-year and inflation projections. The ‘Volume/Mix’ column would be any volume variations that will affect costs, eg product launch and marketing costs of new products, and other known variations such as depreciation increases through increased capital expenditure. The final column is the ‘productivity’ and cost saving initiatives you are budgeting for as reflected in your strategic plan.

Adding your current year forecast dollars to your ‘inflation’ increases, ‘volume/mix’ increases and ‘productivity’ savings (Figure 1, Column E) will give you a budget Selling and Administration Overhead budget for next year, refer Figure 1, Column F below.

As a point of reference, some companies have a target percentage-of-sales ratio they use to cover these Selling and Administration Overheads to ensure that these overheads stay in control.

spreadsheet blog 16

START-UPs

If you are a start-up, hopefully your research will have identified the overhead resources you will need so you can sell your products/services and run your business. Put some values around the resources required to derive a simple budget for these costs for the next financial year.

SUMMARY

Use this week to develop your Selling and Administration Overhead Budgets and continue building the budget picture to provide a sound foundation for business success.

As always, if you need some help or guidance, don’t hesitate to call me on (03) 9554-3128.

Next week we will pull together all the Profit and Loss forecast and budget data you have completed so far and add in some last pieces to come to your draft current year forecast and next year budget Profit and Loss statement.

Ross

Business Blog No 15 – Budget – Production and Distribution Overheads

Last week you completed your cost of sales budget, and hence determined a key metric: budget gross margin. A key take away from last week was the need to ensure you budget to make a gross margin that will cover your budget overheads and make a sufficient budget profit.

This week, we move onto the first of those budget overhead categories: Production and Distribution Overheads. Note the topic this week will not be relevant to service entities, but it is relevant to entities that are product focussed either as manufacturers and/or resellers/distributors.

PRODUCTION AND DISTRIBUTION OVERHEADS – EXISTING BUSINESSES

Distribution Overheads will apply to both manufacturers and distribution/reseller entities.  Distribution Overheads include costs such as Warehouse Labour and Freight Outwards. Production Overheads will only apply to manufacturers and are the factory costs not already picked up in cost of sales (direct labour and variable overheads) and are relatively fixed. Major categories of Production Overhead costs include Production Supervision Labour, Stores Labour, Maintenance Labour, Repairs & Maintenance (R&M), Rent and Plant Depreciation.

The process and concepts that follow are equally applicable to both types of overhead costs and to all entities that incur any of these types of costs.

Your accounting system should already be reporting these costs as separate line items so this is your starting point for your current year forecast and then budget. A simple spreadsheet will be useful for preparing the forecast for the current financial year and budget for next financial year. Collect the year-to-date (YTD) actual costs by category. Let’s assume you have YTD actual costs for the 10months to April; refer Figure 1, Columns A and B below. Next you need to forecast the next 2months costs. A simple pro-rata using YTD Actuals can work if you have no other information to go on, refer Column C below. Adding these two numbers together gives you your current year full year forecast, refer Column D.

Next add another 3 columns to your spreadsheet and put in ‘inflation’, ‘volume/mix’ and ‘productivity’ columns representing movements from your forecast to your budget figures (refer Figure 1 column E). ‘Inflation’ would reflect known EBA or payroll rate increase from year-to-year and inflation projections. The ‘Volume/Mix’ column would be any volume variations that will affect costs. eg Waste, and other known variations such as depreciation increases through increased capital expenditure. The final column is the ‘productivity’ improvements you are budgeting for as reflected in your strategic plan.

Adding your current year forecast dollars to your ‘inflation’ increases, ‘volume/mix’ increases and ‘productivity’ savings (Figure 1, Column E) will give you a budget production overhead for next year, refer Figure 1, Column F below.

spreadsheet blog 15

START-UP’s

If you are a start-up, hopefully your research will have identified the overhead resources you will need to run your factory and/or distribute your product. Put some values around the resources required to derive a simple budget for these costs for the next financial year.

SUMMARY

Use this week to develop your Production and Distribution Budgets (as applicable) and continue building the budget picture to provide a sound foundation for business success.

As always, if you need some help or guidance, don’t hesitate to call me on (03) 9554-3128.

Next week we continue with Overhead Budgets focussing on Selling and Administration Overheads.

Ross

Business Blog 14 – Cost of Sales Budget Part 3 Variable Overheads and Gross Margin

This week is the final part of a 3-part topic focussed on developing a Cost of Sales Budget for the next financial year, and so determine your gross margins.

The definition of variable overheads in a cost of sales context for both products (Cost of Goods Sold) and services (Cost of Services) is the overhead that varies directly with the volume of production of the product or service. The variable overhead costs include things such as energy, consumables and factory supplies. Note that this week’s topic is not relevant to import/distribution/reseller entities that don’t produce goods or services.

MANUFACTURER/SERVICE PROVIDER – IF YOU HAVE MACHINE OR LABOUR ROUTINGS

As with last week, if you have a computer system, or excel spreadsheets that you use for machine and/or labour routings by product/service showing how many hours it takes to produce the product/service across the various production work centres, you can use the budget hours as determined in the direct labour hours exercise last week as your starting point. You can then use the actual current year-to-date (YTD) hours and volumes and actual direct variable overheads YTD and pro-rata these overheads for the machine or labour hour and volume movements between current year forecasts and next year’s budget.  You then need to consider efficiency improvements or productivity savings you may have included as part of your strategic planning process and reflect those in your direct variable overhead budget also.

As with last week, you can then derive ‘budget overhead recovery rates’ for your work centres and ‘push’ them back into your machine/labour routes so as to build up budget variable overhead costs by product/service, refer Figure 1, column L.

spreadsheet blog 14

MANUFACTURER/SERVICE PROVIDER – IF YOU DON’T HAVE MACHINE OR LABOUR ROUTINGS

If you don’t have machine or labour routings, you are best to look at using the actual current year-to-date (YTD) volumes and actual direct variable overheads YTD as a starting point and pro-rata these overheads for the volume variations between current year forecasts and budgeted volumes for next year. Factor in rate and inflation increases and also reflect any productivity initiatives you have identified in your strategic planning process that you expect to generate savings in variable overheads.

START-UP MANUFACTURER/SERVICE PROVIDER

If you are a start-up, hopefully your research will have identified the direct variable overhead resources you will need to deliver your product/services based on your budgeted volumes. Put some values around the resources required to produce your product/service for the financial year.

GROSS MARGIN

Sales less Direct Materials less Direct Labour less Direct Variable Overheads = GROSS MARGIN

Gross Margin is a key measure of business performance and you should be targeting a gross margin percentage (Gross Margin dollars divided by Sales dollars) that will cover your fixed overheads and make an  profit at the appropriate levels; refer Figure 1, column M and N.

spreadsheet blog 14 no 2

Use this week to develop the final component of your Cost of Sales budget, your Direct Variable Overheads Budget for the next financial year, and thus your Gross Margin, to provide a sound foundation for business success.

As always, if you need some help or guidance, don’t hesitate to call me on (03) 9554-3128.

Next week we move onto the Overhead Budgets starting with Production, Freight and Distribution Overheads.

Ross