Firstly, congratulations for coming on this journey with me so far! This week, we pull everything we have done for your forecast and budget together to come up with a Profit and Loss (P&L) Forecast for the current financial year and P&L Budget for next financial year. Very exciting!
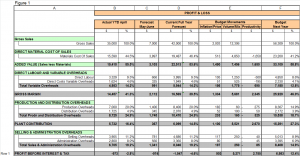
Using the information developed so far, and your excel spreadsheets, following is a schedule (Figure 1) that pulls it all together to give us a first look at your first cut P&L Forecast and Budget. Note, I have used most of the numbers used so far as illustrations, they are fictitious numbers and some have been altered for illustration purposes only.
Figure 1
- Column A lists out the P&L categories used in your workings so far.
- Column B is the actual year-to-date April figures for each P&L category, plus some percentages for reference.
- Column C is the forecast derived for the May and June months for each P&L category.
- Column D is the current full year forecast for each P&L Category, plus some percentages (Column B plus C).
- Column E is the budget movements in “Inflation/Price”, “Volume/Mix” and “Productivity” improvements for each P&L category you have determined.
- Column F is the next financial year budget as computed by each P&L Category, and reflects the sum of column D plus the three sections of column E. Percentages are also illustrated for reference and comparison purposes.
Looking at all the information you have complied, you will have determined a Profit before Interest and Tax (PBIT) figure in Row 1. How does it look? Does it make sense? Is the year-to-date figure correct and does it match your actual numbers? Is the current year forecast reasonable given you are coming towards the end of the financial year? Do the ‘price’ and ‘volume’ figures look reasonable and does the ‘productivity’ total saving figure in Column E Row 1 agree with your Strategic Plan initiatives?
If you are happy with what you are seeing, you need to add a few more rows to the spreadsheet as noted below, Figure 1, Rows 1 to 5. Row 1 is the Profit Before Interest and Tax (PBIT) as per above.
If you have borrowings, loans or a bank overdraft for your business, you will be paying interest to the applicable financial institution/s. Row 2 is where you show the interest expense you are forecasting and budgeting to pay. Subtracting the interest expense amount from your PBIT will give you Profit Before Tax (PBT), refer Row 3. Applying a standard tax rate of say 30%, you will determine your Tax Expense in Row 4.
Subtracting tax expense from PBT gives you Profit After Tax (PAT), Row 5. This is possibly the most important number you have! Is it positive? Does it look reasonable? Does the number give you the desired Return on Investment you identified in week 7? You should recall that you need to be making a return on your investment (ROI) to reflect the risk you are taking. If you are not achieving your target return on business investment, you need to have a plan to get you there, if not in this budget year, at least in the medium term.
If you are not making that required return on investment, what areas can you focus on to get to that required level of return? Can you aggressively budget more sales growth harder? Increase prices further? Do some cost cutting? Make further productivity improvements? Or a combination of all of the above? Is it something that needs to be done over a number of years?
SUMMARY
Use this week to pull together your first draft forecast and budget Profit and Loss (P&L) and look at where you are at insofar as Return on Investment (ROI) objectives. Review and adjust your forecast and budget accordingly to come to a final P&L forecast and budget and provide a sound foundation for business success.
As always, if you need some help or guidance, don’t hesitate to call me on (03) 9554-3128.
Next week we will look at phasing your final budget by month ready for the new financial year so you can start comparing actual results for each month against your budget.
Ross


