
The end of the first quarter of the 2016/17 financial year signals a change in focus for my blog. We circle back to the phased budget we prepared earlier in the series and do our quarterly review of your actual Q1 results compared to the budget and prior year.
Your Accountant or CFO or Virtual CFO or Part-Time CFO should be providing this management reporting and analysis within a week following month-end. The timeliness, interpretation and understanding of the numbers are key, and exceptions should be noted or flagged early for explanation and/or remedial action if required.
In my experience, the financials should be presented in a concise but comprehensive slide deck of six or seven slides/pages. As a guide, try having the P&L and related reporting taking 5 slides, and one slide each for the Balance Sheet and Cashflow. The slide deck should be presented and discussed at a monthly management meeting.
PROFIT AND LOSS
This week we will look at the Profit and Loss statement. The following assumes a manufacturing entity, but is easily translatable to any entity for reporting purposes by ignoring irrelevant lines such as materials.
Ideally your P&L reporting should be in a format which shows actual month and quarter numbers alongside budget month/quarter and prior year month/quarter per the illustration following in Figure 1. Graphs can also be used to illustrate the story too for as the saying goes ‘a picture tells a thousand words’.
Each line of your P&L should be reviewed by your Accountant or CFO in the first instance comparing budget and prior year figures and flagging exceptions (TIP: I use a colour code system of RED and GREEN as an effective flag for exceptions).
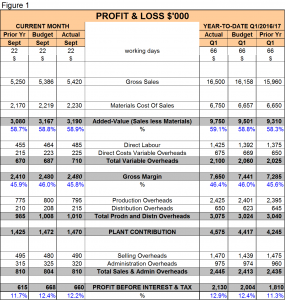
Looking at the details.
SALES
The Sales numbers require a drill down analysis which is a Price-Volume-Mix Variance analysis by category or segment. This should be the second page of your P&L Report and will help explain any variation in sales between actual, budget and prior year.
MATERIALS AND ADDED VALUE
An analysis should be undertaken to understand the material numbers and ratios for such things as Material Purchase Price Variances, Material Scrap and Usage Variances, Stocktake Variances and exchange rate variances for imported materials. With this information, combined with the sales analysis above, you should be in a position to understand what is driving these numbers and why they vary in comparison to the budget and prior year figures.
DIRECT LABOUR AND VARIABLE OVERHEADS
As with materials, you need to further analyse the direct labour numbers and drill down into things such as non-productive time, overtime, labour efficiency and even labour rate variances. It is the same with variable overheads; you need to get into the detail to understand the exceptions and the bigger picture.
GROSS MARGIN
Again, by using all the information and analysis gathered above, you should be able to explain the gross margin variances and also the % variances.
PRODUCTION, DISTRIBUTION, SELLING and ADMINISTRATION OVERHEADS
A dissection of the overheads incurred by the business should be listed in another report with a ‘dice-and-slice’ by department included in the report. Again exceptions need to be flagged and understood.
PROFIT BEFORE INTEREST AND TAX (PBIT)
Having completed the analysis, the story behind your PBIT should be clear. I hope you can see that by diving into each line of the summary P&L, you build up a concise picture of why your actual profit/loss varies to budget and prior year. The numbers are nothing without understanding the story behind them and they can prove to be an insightful and powerful tool for building a sound foundation for business success.
You might notice my slogan that goes my logo is “going beyond the numbers” and that is exactly what you should expect from your key finance personnel.
Next week will move to the Balance Sheet.
Ross – Billson Advisory


