Tag Archives: Virtual CFO

Business Blog No 34 – Q1 Cashflow Statement

This is the third part of a four-part series looking at the first quarter results of the 2016/17 financial year.  Previously, we have looked at the Profit and Loss and the Balance Sheet Reports. This week we look at the Cashflow Statement and undertake a quarterly review of your actual Q1 results compared to the budget and prior year.

Your Accountant or CFO or Virtual/Part-Time CFO should be providing you with your management reports and analysis within a week following month-end in a concise but comprehensive slide deck of six or seven slides/pages. The Cashflow Statement will be one of the slides in the slide deck, which should be presented and discussed at your management review meeting.

In relation to the last two newsletters, it is interesting, but not surprising, to note that the Profit and Loss Statement newsletter received 30% more ‘reads’ then the Balance Sheet newsletter. The pre-occupation with profit is understandable, but Balance Sheet management is just as important as Profit and Loss achievement.

CASHFLOW STATEMENT

I suspect that this newsletter with get less ‘reads’ than the Balance Sheet newsletter, but it really is a key part of this trio of management reports. The Cashflow Statement pulls the Profit and Loss Report plus the Balance Sheet report together to show how the movement in cash balances has occurred during the quarter.

Cash of course is the key number for SME’s, without it, your business will certainly fail, hence the importance of the Cashflow statement cannot be understated.

blog-34-cashflow

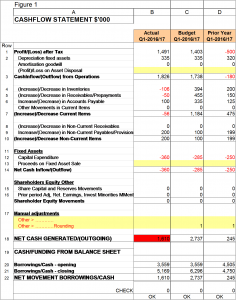
Back in Newsletter 20, you created your Budget Cashflow Statement. Using that same format, below is an example of a Cashflow Statement slide showing actual values/movements for the Q1/2016-17 (Column B), Budget for Q1 (Column C) and then the prior year Q1 actual values (Column C); refer Figure 1 below. Graphs and charts can also be used for illustration purposes.

Each variation exception should be reviewed by your Accountant or CFO in the first instance comparing budget and prior year figures and flagging variances/issues. TIP: I use a colour code system of RED (PROBLEM), ORANGE (WARNING) and GREEN (GREAT) as an effective flag for exceptions (refer Figure 1).

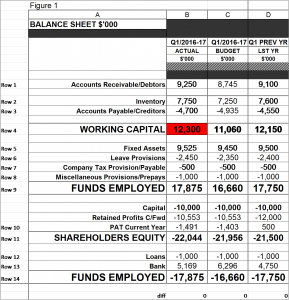
By understanding the assumptions on which the budget Profit and Loss and Balance Sheet numbers have been derived, you should be able to understand why your actual Bank Balance figure vary to the budget. At a macro level, in the example I have used over the last two newsletters, we achieved higher than budget profit, and yet our cash balances are well short of budget. The reason for this is we are carrying excess inventories, our Accounts Receivables balances are higher than budget and we are spending in capital faster than budget. Refer Figure 1 below. Actions should be taken to address these issues clearly.

blog-34-cashflow-statement

SUMMARY

Use this week to understand and analyse your Cashflow Statement for Q1 as it is the lifeblood of your business and provides a sound foundation for business success.

NEXT WEEK

Next week will move to the fourth Q1 report, Forecast Report.

WE HAVE MOVED

We have recently moved from our Dandenong South location to be more central to our client’s locations. You will now find us at Ground Floor, 203-205 Blackburn Road, Mount Waverley, VIC, 3149. Our new phone number is (03) 9847-6834. As always, if you need any help or want a no obligation chat, don’t hesitate to contact us.

Ross – Billson Advisory

Business Blog No 33 – Q1 Actual Balance Sheet

This is the second part of a four-part series looking at the first quarter results of the 2016/17 financial year.  Last week we looked at the Profit and Loss, this week we look at the Balance Sheet and undertake a quarterly review of your actual Q1 results compared to the budget and prior year.

Your Accountant or CFO or Virtual CFO should be providing you with your management reports and analysis within a week following month-end in a concise but comprehensive slide deck of six or seven slides/pages. The Balance Sheet will be one of the slides in the slide deck, which should be presented and discussed at your management review meeting.

BALANCE SHEET

The Balance Sheet is a report that shows ‘what you own’ and ’what you owe’ at a point in time, ie September 30th in this case. What you own are your Assets, and what you owe are your Liabilities and Shareholder’s Equity.

blog-33-balance-sheet-scales

Back in Newsletter 19, you created your Budget Balance Sheet. Using that same format, below is an example of a Balance Sheet slide showing actual values as the end of Q1/2016-17 (Column B), Budget for end Q1 (Column C) and then the actual values as at the end of Q1 for the Prior Year (Column C); refer Figure 1 below. Graphs and charts can also be used for illustration purposes.

Each line of your Balance Sheet should be reviewed by your Accountant or CFO in the first instance comparing budget and prior year figures and flagging exceptions. TIP: I use a colour code system of RED (PROBLEM), ORANGE (WARNING) and GREEN (GREAT) as an effective flag for exceptions (refer Figure 1).

By understanding the assumptions on which the budget Balance Sheet numbers have been derived, you should be able to understand why your actual Balance Sheet figures vary to the budget. Key numbers such as Working Capital should have particular attention, refer Row 4 in Figure 1 below.

Ratios are also an excellent way to identify the health of your Balance Sheet. Some good examples include Stock Turns (if a product based business); Debtors Days Outstanding; Working Capital %; Quick Asset ratio, Return On Funds Employed (ROFE). Your Accountant or CFO should be across the best ratios to use for your particular business.

blog-33-balance-sheet

That is the beauty of Accounting and the ‘numbers’. When you understand what is behind them, you become more aware of issues in your business and can address them and measure the impact of your actions.

SUMMARY

Use this week to understand and analyse your Balance Sheet as at the end of Q1 to provide a sound foundation for business success.

NEXT WEEK

Next week will move to the third Q1 report, a Cash Flow statement.

Ross – Billson Advisory

Business Blog No 32 – Q1 Profit and Loss

The end of the first quarter of the 2016/17 financial year signals a change in focus for my blog. We circle back to the phased budget we prepared earlier in the series and do our quarterly review of your actual Q1 results compared to the budget and prior year.

Your Accountant or CFO or Virtual CFO or Part-Time CFO should be providing this management reporting and analysis within a week following month-end. The timeliness, interpretation and understanding of the numbers are key, and exceptions should be noted or flagged early for explanation and/or remedial action if required.

In my experience, the financials should be presented in a concise but comprehensive slide deck of six or seven slides/pages. As a guide, try having the P&L and related reporting taking 5 slides, and one slide each for the Balance Sheet and Cashflow. The slide deck should be presented and discussed at a monthly management meeting.

PROFIT AND LOSS

This week we will look at the Profit and Loss statement. The following assumes a manufacturing entity, but is easily translatable to any entity for reporting purposes by ignoring irrelevant lines such as materials.

Ideally your P&L reporting should be in a format which shows actual month and quarter numbers alongside budget month/quarter and prior year month/quarter per the illustration following in Figure 1. Graphs can also be used to illustrate the story too for as the saying goes ‘a picture tells a thousand words’.

Each line of your P&L should be reviewed by your Accountant or CFO in the first instance comparing budget and prior year figures and flagging exceptions (TIP: I use a colour code system of RED and GREEN as an effective flag for exceptions).

blog-32-spreadsheet

Looking at the details.

SALES

The Sales numbers require a drill down analysis which is a Price-Volume-Mix Variance analysis by category or segment. This should be the second page of your P&L Report and will help explain any variation in sales between actual, budget and prior year.

MATERIALS AND ADDED VALUE

An analysis should be undertaken to understand the material numbers and ratios for such things as Material Purchase Price Variances, Material Scrap and Usage Variances, Stocktake Variances and exchange rate variances for imported materials. With this information, combined with the sales analysis above, you should be in a position to understand what is driving these numbers and why they vary in comparison to the budget and prior year figures.

DIRECT LABOUR AND VARIABLE OVERHEADS

As with materials, you need to further analyse the direct labour numbers and drill down into things such as non-productive time, overtime, labour efficiency and even labour rate variances. It is the same with variable overheads; you need to get into the detail to understand the exceptions and the bigger picture.

GROSS MARGIN

Again, by using all the information and analysis gathered above, you should be able to explain the gross margin variances and also the % variances.

PRODUCTION, DISTRIBUTION, SELLING and ADMINISTRATION OVERHEADS

A dissection of the overheads incurred by the business should be listed in another report with a ‘dice-and-slice’ by department included in the report. Again exceptions need to be flagged and understood.

 PROFIT BEFORE INTEREST AND TAX (PBIT)

Having completed the analysis, the story behind your PBIT should be clear. I hope you can see that by diving into each line of the summary P&L, you build up a concise picture of why your actual profit/loss varies to budget and prior year. The numbers are nothing without understanding the story behind them and they can prove to be an insightful and powerful tool for building a sound foundation for business success.

You might notice my slogan that goes my logo is “going beyond the numbers” and that is exactly what you should expect from your key finance personnel.

Next week will move to the Balance Sheet.

Ross – Billson Advisory

Business Blog No 31 – Agri StartUp

This week, I thought I would follow on from the theme of last week’s blog on food and agriculture, and introduce you to the area of Agricultural Technology StartUp, or Ag-Tech. Things such as the commercial application of drone technology, robotics and sensors to the agricultural sector are examples of such ag-tech.

Given the world’s growing population and finite resource availability, agriculture needs to become more productive and innovative to feed the growing population. Agriculture has always been a key industry for Australia and with the opportunities presented by our location and region, and China in particular, our ageing agricultural producer population is seeking to bring scientists and IT professionals to the industry. Along the way inspiring a new generation of agricultural personnel.

blog-31-agri

A new entity has recently been created by a joint venture between the National Farmers Federation and a private equity partner. This new entity creates an Ag-Tech support centre to kick-start start-ups for the sector focussed on developing new agricultural technology.

SproutX

The entity, SproutX, launched recently and is based in Melbourne. It is the first entity of its type in Australia and has received State Government support. It is now accepting applications for its Pre-Accelerator program and will soon be accepting applications for its Accelerator program.

The Pre-Accelerator program is currently open and offers a free 6-week course to prepare start-ups for the Accelerator program itself, by fleshing out ideas, providing mentoring, online lectures and some cash to go towards bringing ag-tech ideas to life.

The Accelerator program itself is backed by a $10million fund. It gives ag-tech start-ups access to all the best practical and mentoring advice, cash grants, distribution opportunities, media, PR and office space in an ag-tech hub with direct access to experts and connections to the agriculture industry. The goal is commercialisation of ag-tech ideas. Applications open in November for this program.

An aside

Ironically, I heard 2016 Casey Cardinia Business of the Year, Australian Fresh Leaf Herbs, co-founder Mr. Jan Vydra speak at a business breakfast last week about the need for evolution of the sector and the challenges of making farming attractive to young entrepreneurs.

The SproutX initiative presents a great opportunity for fledgling agricultural startups to provide a sound foundation for business success, as well as the success of the agricultural sector itself.

Next Week

Due to recent requests, the blog next week will focus on management reporting and analysis covering the end of the first quarter of this current financial year. We will start with the Profit and Loss Report next week.

Ross – Billson Advisory

Business Blog No 30 – Trade Show

I recently attended the Fine Foods Trade Expo at the Melbourne Convention and Exhibition Centre on a cold wet Melbourne Day. You might be wondering what an accountant is doing at such a trade show event?

I find attending such an event gives me a perspective and update on the state of such a key industry. It is a source of ideas and inspiration for me and my clients and, naturally, a place to network with prospective customers.

Officially titled the ‘Fine Food Australia: The 32nd Australian International Food & Drink Exhibition’, the annual four-day trade only event alternates yearly between Melbourne and Sydney.

Over 1,000 exhibitors and 25,000 visitors salivated at the array of available samples alongside over 3,500 interstate buyers and over 700 international buyers from around 50 countries. The 30k SqM of exhibition space was split into 10 smaller zones:- Catering Equipment, Retail Equipment, Hospitality Equipment, Packaging, Baking Food, Fine Food, Meat & Seafood, Free From/ Natural Products, Dairy World, Drinks World and Flavours of the World (International Pavilions).

fine-foods-expo

Regular demonstrations and educational presentations were in evidence along with the usual networking opportunities. Previous Fine Food Show statistics from the 2014 Melbourne Exhibition identified $90k+ in sales leads were generated from an average 100+ leads for each exhibitor. At $3.5k for a 3metre by 3metre booth, the return on investment is sound. Even if you are not directly in the Food business, it might present an opportunity to think outside the box and figure out how you can get involved in this growing agribusiness sector. Packaging companies, ingredient producers, transport entities, shop-fitters etc. should consider attending.

My Take Out

My take-out and thought provoker to you is ‘Have you considered taking out a stand or booth at trade events or expo’s?’ It might be worth considering as it could present an opportunity to find new customers or expand your business networks.

Do you go to any trade shows or expo’s as a visitor just to get some differing incites, trends and ideas you might apply to your own business to provide a sound foundation for business success?

blog-30-moving

Ross – Billson Advisory

Business Blog No 29 – Transfer Pricing

We have all heard the allegations in the media of multi-national entities (MNE) diverting profits away from Australia to lower tax jurisdictions thereby reducing the global tax bill of such MNE’s. Entities such as Google and Apple have been at the forefront of allegations of improper use transfer pricing practices.

us_corporate_profits_1947-2011

Entities can divert profits using a variety of means. The simplest way of doing this is to overstate the cost of imported products from an overseas MNE subsidiary thereby reducing the profits made by the MNE’s Australian subsidiary. This artificially increases the profits in the MNE supplier country which is in a lower tax regime than the Australian subsidiary thereby reducing the overall tax burden for the MNE. Other more complex methods are catching the ATO’s eye with two announcements last week by the ATO putting entities on notice who try to use a partnership structure to avoid the law, or who use circular financing arrangements to transfer income overseas but keep deductions in Australia.

Organisation of Economic Co-Operation and Development (OECD) Transfer Pricing Actions

The OECD’s Base Erosion and Profit Shifting (BEPS) action plan is the foundation of global transfer pricing practices and was released late 2015. It focuses on taxing profits where consumers live. This puts the OECD at odds with US MNE’s who assert that their global income is essentially American income derived by a US company and that it will decide if, how and when it will be taxed it, irrespective of the locations of end consumers.

various-currencies

Australian Actions on Transfer Pricing

The Australian Government has already enacted the Multinational Anti Avoidance Law (MAAL) to ensure that large multinational companies operating in Australia are subject to Australian tax laws. The larger MNE’s subject to these provisions have global revenue of $1billion+. In addition, the Government’s 2016 Budget introduced a new Diverted Profits Tax, a 40 per cent penalty rate of tax on large MNE’s that attempt to shift their Australian profits offshore to avoid paying tax. The combined MAAL and the Diverted Profits Tax are expected to raise around $650 million over four years.

For SME’s in Australia, the ATO has released ‘Simplifying Transfer Pricing Record Keeping’ for entities whose Australian income is below $25million. It doesn’t alleviate obligations under the legislation, but allows such entities to self-assess and simplify what would otherwise potentially be costly compliance requirements.

Documenting how costs and prices are determined as well as the decision making process followed in setting cross border pricing remains key. Benchmarking analysis and the arms-length principles remain best options for ensuring compliance.

The new transfer pricing regime remains largely untested in the courts, so please ensure you get good advice on the documentation requirements and methodology used in setting cross border prices if you operate within a structure whereby related entities are located both here and overseas and these entities transact with each other.

Ross – Billson Advisory

Business Blog No 26 – Succession and Exit Strategy

When you start planning to start your own business, you should be also planning how you will exit that business. Starting your own business is perhaps your biggest financial investment, along with your home, and you will want to ensure that the return on this investment is maximised. Will you sell your business through a business broker when the time is right? Will you plan to hand the business onto your children? Will you have a successor ready to take over when you are ready to exit? Or will you simply close the doors and leave it all behind? The ironic thing is that recent surveys indicate that less than half of surveyed SME owners have a succession or exit plan in place.

blog 26

Your exit strategy is a key issue because you want to maximise the value of your business and get the timing right and make sure you don’t have to delay your retirement. An interesting statistic is that the average age of a SME owner is 56! Our ageing population means more and more businesses will come up for sale meaning by pure supply-demand economics, business sale prices will fall. This is particularly relevant as more baby boomers head towards retirement and are looking to exit their businesses.

Before exiting your business, you need to document processes and formalise customer, supplier and employee relationships and ensure that the business is not dependent on you for it to succeed. The business’ profits need to be sustainable in a potential purchasers eyes. Nobody will be interested in buying or running a business which collapses following your exit if you are in reality the business.

It is generally accepted that it takes 3 to 5 years to have a business ‘sale ready’ so don’t delay developing your exit strategy. You want to be ready in case an unexpected offer to buy your business materialises.

Due Diligence

Any potential purchaser of your business will undertake a due diligence process which will cover all aspects of your business to ensure it is legitimate and sustainable and that the numbers presented stand scrutiny. From that due diligence process, a potential buyer will put a value on the business most likely a profit multiple ratio depending on the industry type, scale of business, concentration of customers and key suppliers and the risk profile of the business. Profit multiples used to value a business are falling in recent times illustrating that it is a buyers market when it comes to business sales.

Another option is to put a board in place prior to putting your business up for sale. A board can add value to your business and also make it more saleable and can present an opportunity for you to stay involved as a board member if the new owner so desires (and you too)!

So ensure you have your succession and exit strategy in place as a foundation for business success.

Ross – Virtual/Part-Time CFO

Business Blog No 25 – Casuals and Redundancy

Casual hours to count towards redundancy payouts

Last week, the full bench of the Fair Work Commission resolved that periods of regular casual employment will now be counted towards redundancy entitlement calculations. The advantage to employers in ‘casualising’ their workforce is slowly being eroded away, and this latest decision is another step in that direction.

The decision means that workers who start as casuals before their positions become permanent, either full-time or part-time, will have their full length of service recognised in the calculation of their final redundancy pay out.

blog 25

An appeal by the Australian Manufacturing Workers’ Union was upheld reversing a decision made earlier in the year which allowed a ship building company to only count the period of permanent employment in the calculation of redundancy payments.

To be included in the calculation of years of continuous service, the period of ‘regular and systemic casual employment’ must be part of the period of employment from which an employee is being made redundant. There can be no break between the period of regular and systemic casual employment and the transition to permanent employment.

The decision does not apply to employees who were casuals when their employment was terminated however.

If you are in this situation, you should talk to your Industrial Relations advisor to ensure you are calculating redundancy payouts correctly.

Ross – Virtual/Part-Time CFO

Business Blog No 24 – Startup Tax incentive

Did you know that on July 1st, 2016 some new tax incentives came into force for start-up investors?

blog 24 startup no 1

These are new tax incentives are a key part of the federal government’s $1billion innovation agenda to encourage innovation and investment in early stage entrepreneurship in the start-up sector. This is designed to encourage early stage investment and funding in such entities which have limited access to traditional sources of funds at the development phase of their start-up journey. It is estimated that over 4000 early-stage companies are missing out on equity finance each year. To address this, the government is targeting $1 billion to be raised in the early years of the new tax incentives.

The key points of the new tax incentives are that they offer up-front tax offsets of 20% to a maximum $200k, plus 10year capital gains tax exemptions for eligible investors in eligible entities.

A startup entity that qualifies for such treatment for investors is defined as an Early Stage Innovation Company (ESIC). This basically means that the entity has been incorporated less than 3years ago, has income of less than $200k and costs of less than $1million for the financial year ending June 30, 2016, and is developing new or significantly improved innovations with the purpose of commercialisation.

blog 24 startup no 2

If you think you might be eligible for such incentives as a startup investor or want to use the legislation to encourage investment in your startup, speak to your tax accountant.

Ross – Virtual/Part-Time CFO

Business Blog No 23 – The Cloud

Cloud computing is not new. We have all used eBay, Google, Facebook, Gmail etc. which are all cloud based. The problem is that the word ‘cloud’ is a misnomer and perhaps makes us feel that our data is in ‘outer-space’ somewhere. All cloud hosting companies actually run huge physical servers in big data centres across the globe to store the data.

Just like plugging into a grid to get access to what a company or individual wants and needs, ‘cloud’ is a subscription based pay as you go service where you don’t own the infrastructure or software but rather subscribe to access it. There are various versions of the ‘cloud’ including Software as a Service (SaaS), which means using cloud based software solutions, and Data Protection as a Service (DPaaS) which means replicating and backing up data to the cloud or to a third party disaster recovery provider.

Being in the ‘cloud’ does have many ‘silver linings’ such as allowing flexibility and giving you access to the latest technology from anywhere there is an internet connection. A start-up can also access the same technology as a big corporate. A key advantage of moving to the cloud is the cost savings from no longer needing to purchase hardware infrastructure and software licenses; instead you pay a regular monthly subscription fee. This also converts a capital cost to a deductible expense. Going to the cloud can also facilitate efficiency improvements and cost savings freeing up resources. It also enables easy sharing of data and financials and is a real time one view of the truth.

There are risks of going to the cloud and these include the risk of data loss, security risks and access issues being out of your control. So good data security and backup procedures remain key. It is however argued that cyber security risks are actually reduced by sitting in the cloud as the companies that provide cloud services invest more money in security than individual companies would and they have specialists managing the cyber-security matters. Privacy Laws may come also into play. A solution to this is for customers’ personal data not to be stored in the cloud, allowing only business process tools to sit in the cloud.

A key step before moving to the cloud is to firstly assess what the real business requirements are and what are the objectives of your IT needs and your IT budget itself.

Look for a cloud service provider who has achieved the internationally recognised ASAE 3402 certification and that sound SLA’s (Service Level Agreements) are in place with these providers and that issues of locking-in and transferability are covered. Naturally get some customer references to validate the providers claims.

It might mean dipping your toe in the water with things such as Microsoft Office 365, Cloud-based Antivirus software, payroll systems or accounting software eg MYOB. A staged approach of moving to the cloud and ensuring adequate training for staff ensures your business won’t be overwhelmed by taking on too much at once.

From our survey earlier in the year, a surprising result was the apparent slow uptake of cloud based IT solutions. For the vast majority of the survey respondents, IT systems are still kept in-house.

From my perspective, cloud solutions are the future and are great productivity and cost saving opportunities. Converting your in-house software platforms (and the associated reduction in necessary infrastructure costs and maintenance) to a cloud based solution by a subscription model is recommended. Beware of IT support providers who advise clients to avoid going to the cloud due to their own self interests. To take the mystery out of cloud computing, just remember all our personal emails have always sat on a server somewhere in the “cloud” until we retrieved them and that hasn’t seemed to have bothered us…

Ross – Virtual/Part-Time CFO